Pumps and valves are vital to so many industries to keep their valuable money-making processes functioning. First let’s examine pumps. In so many industries around the globe pumps are vital dynamic pieces of process equipment. Without the pumps the process stops. I am amazed how little attention is given to pumps and pump monitoring. Pumps in general are some of the least monitored, but vital to the plant’s performance regardless of what industry. Fertilizer production is not unique regarding this situation. All too often pumps are run to complete failure and then repaired or disposed of and replaced.
There are new trends where process plants are starting to utilize bearing monitoring to determine when vibration intensifies, and work is scheduled to repair a valuable and vital asset. However, is bearing monitoring the entire solution? In many cases pumps are purchased and assumed to be a 5 – 10-year asset or more. In some cases, those valuable pumps are replaced every 1 to 2 years. How could that be when a pump normal lifetime is somewhere in the 7-year range.
The answer is simple. Are the pumps running at their optimal best efficiency point (BEP)? If the pumps run consistently off the pump’s BEP, then the loads on the pump shaft and bearings increases stressing the pump 100% of the time it is running, thus fatiguing the pump at accelerated rates. The BEP is typically related to the MTBF of the pump, which is represented by a bell curve with the BEP the point on top of the MTBF curve representing 100% of the expected life.
Digital Pump Monitoring Solutions
In many situations there is valuable information that can be captured about a pump’s health, load and performance. Information from flow meters, pressure transmitters, vibration sensors, variable speed drive data and motor and bearing temperature can all share very valuable information. The trend with pumps is to monitor bearing condition. This is extremely valuable and help prevent major damage and downtime for the pump. But this is only the tip of the iceberg for pump monitoring. The normal PLC or SCADA system provides much data for pump monitoring and performance. But tools with higher level analytics are available today.
Below is an example of how higher-level analytics can help improve overall performance of pumps. First though is the back story to these pumps. The user wanted to know about bearing condition but wanted to monitor where the pump was operating compared to the pump curve. The pumps they are using should normally have a 5 – 10-year lifetime. This user is replacing their pumps annually. These pumps are not inexpensive and typically cost $60 – 80K per pump. This user has some 250 pumps of a similar design.
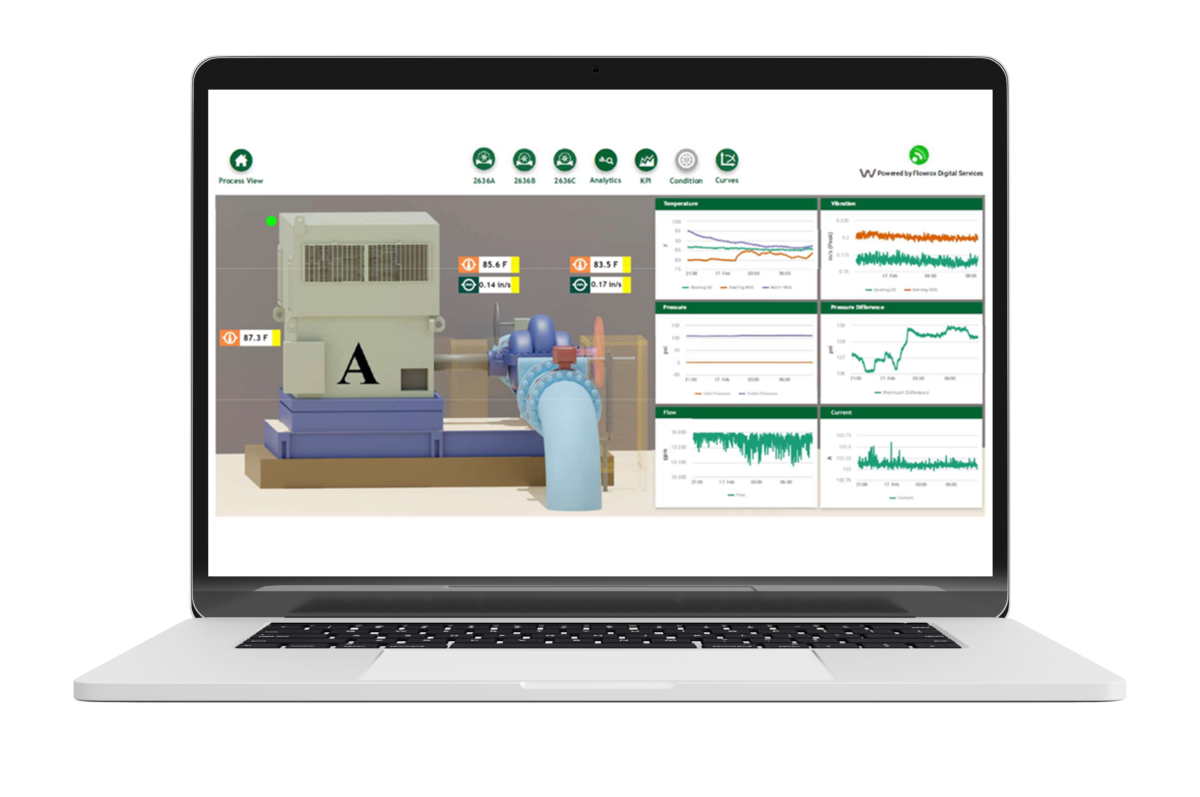
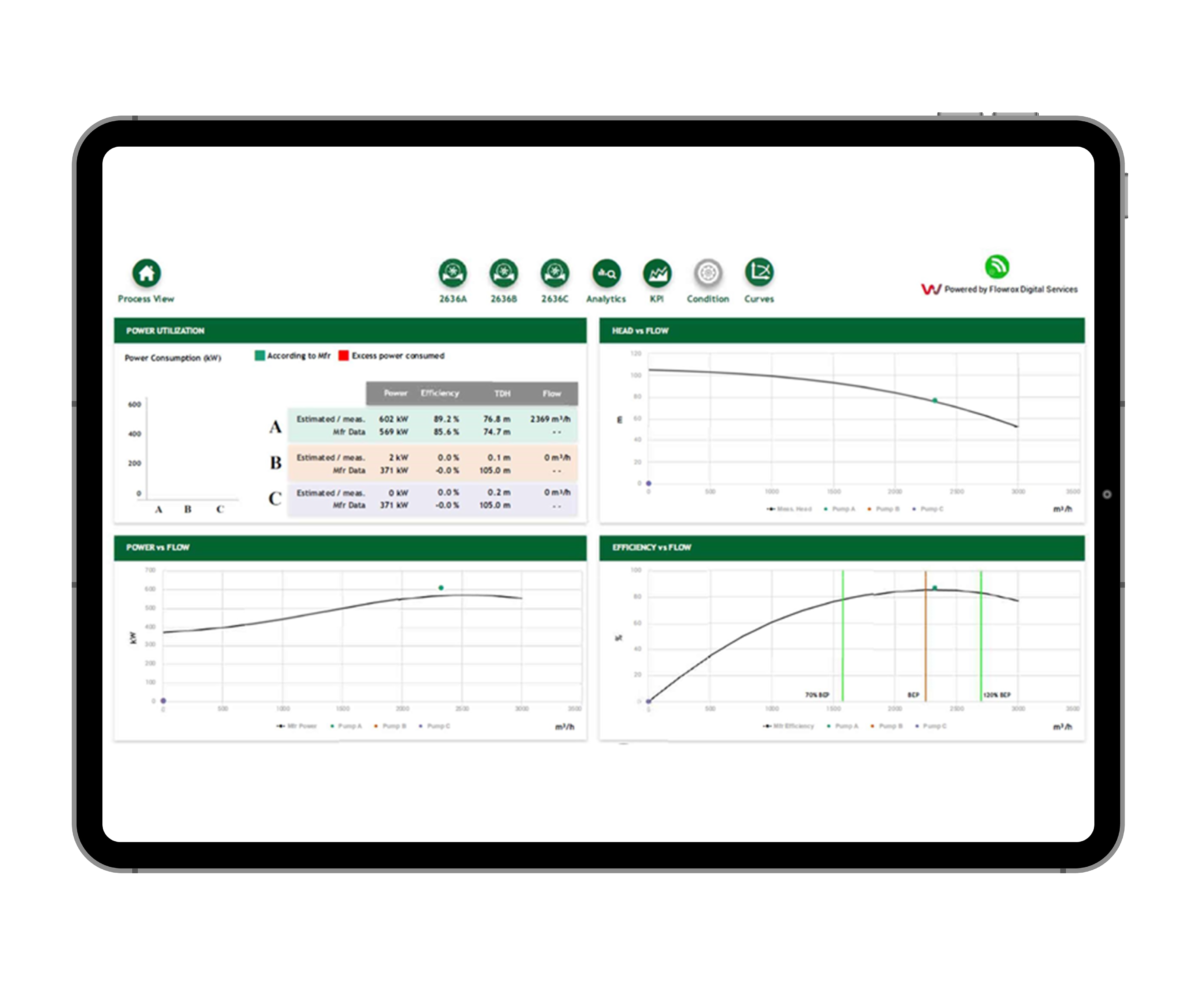
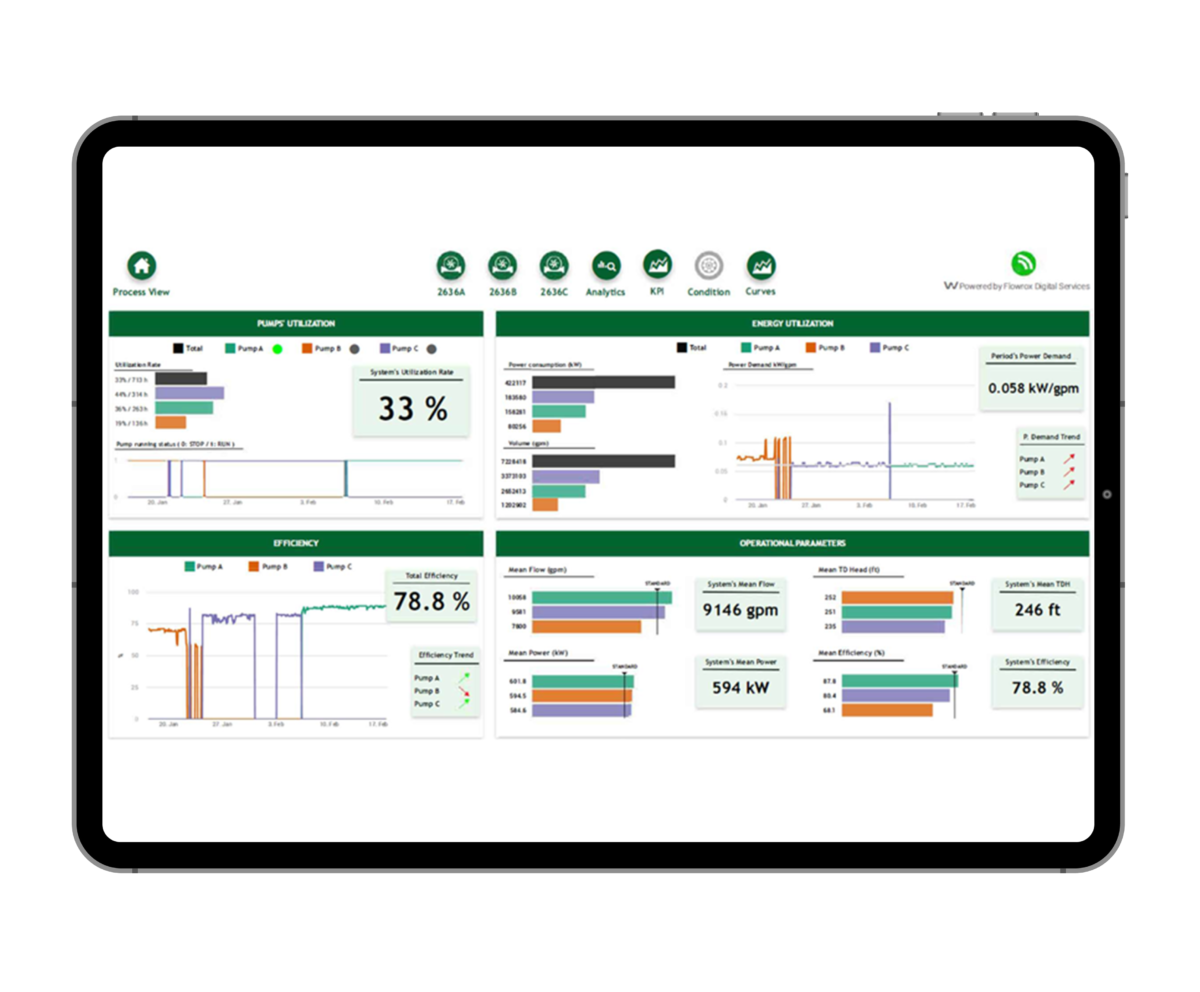
Above pumps A, B and C are monitored. Due to winter temperatures pump A is primarily run only because it can cover the entire flow required. If additional flow is required, then pump B will be activated and make up the remaining flow. Pump C is a standby pump in the event anything happens to pump A and B. In the above pump A is functioning on the pump curve. Also, the pump is performing very close to the BEP or best efficiency point. Prior to having digitalized pump monitoring, the owners were running pump A and B simultaneously and both pumps were operating well below their pump curves and also well far from the BEP. So, these two pumps were constantly in a stressed condition while running. Now since only running pump A it is operating almost on the BEP and pump B does not have to run at all. When summer conditions return the two pumps will be required to produce the required flow, but they will be optimized to produce the best outcome of the pump curve and BEP.
If you analyze what has been shared thus far the benefits are as follows:
- Different pumps run more efficiently than others. Knowing which pump runs the most efficiently allows owner to operate the pump that produces the desired flow rate at the lowest cost
- Pumps manufactured by different manufacturers can be analyzed to determine which pump performs the best at the lowest cost.
- Pumps that are performing at a sub-par level may indicate that the pump requires attention. Obviously, increased bearing vibration indicates the need for bearing replacement. However, a pump that is consuming more energy and producing lower flow rates than comparable pumps may indicate that the impeller may be worn and need replacement. Or simply, one manufacturer’s pump may not perform at a similar efficiency than another brand.
- Visual indication of pump performance compared to the pump curve and BEP allow users to fine tune pump performance for extending pump lifetime, decrease wear, decrease maintenance and downtime.
- Operating the most efficient pump at its highest efficiency can lead to impressive energy savings for the user. They can truly monitor costs of pumping and optimize the process. And again, they can see how one brand of pump performs compared to others. True cost of ownership can be studied and understood by the user.
Digitalized Valve Monitoring
Digitalization can be added to valves as well. Many may not think that valve monitoring is that vital, but when valves are as large as those depicted in figure 4, there are advantages to monitoring. For example, by monitoring valve movement vibration, early signs of valve fatigue or wear can be detected. Also, leakage monitors can be installed to detect early sealing damages. Finally, hydraulic pressure and hydraulic cylinder seals can be monitored for fatigue and failure. Much like pump monitoring these large diameter valves are expensive and vital to production. Early wear monitoring can help to minimize plant downtime, decrease maintenance costs and increase profitability.
Industrial Filtration for Fertilizer Production
Filtration can be used to maximize precious metals recovery, used for dry stacking and tailings. Phosphoric acid production requires filtration for separating the valuable liquids from the waste solids. The process can be highly acidic, high temperature and have scaling properties. For this reason, effective cake-washing and filter media cleaning is an absolute requirement. There are multiple types of filters used in fertilizer production. They can be pressure filtration, vacuum belt filtration and vertical tower pressure filters.
Digitalization of the Filtration Process
Regardless of which type of filtration technology utilized, filtration can be optimized with the right type of digitalization services. The results can be less consumption of compressed air, water, higher filtration production rates, lower energy consumption and increased cake or filtrate quality. An effective digitalization package can reduce energy consumption of vacuum belt filtration up to 40%.
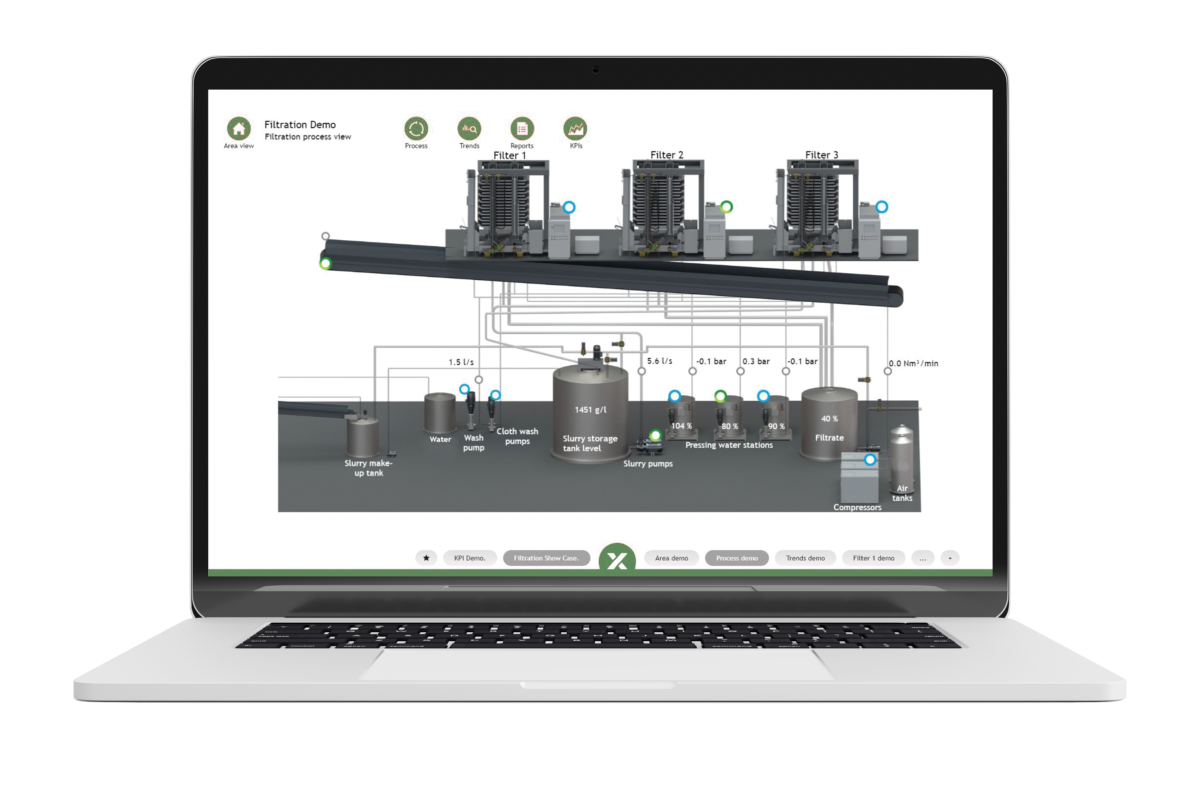
The three vertical tower pressure filters that were digitally reproduced above, have roughly 100 inputs per vertical tower press being analyzed by digital solutions provided by Roxia. The owner of these zinc mine filters assumed these filters were under high utilization rate. After installing digitalization monitoring it was realized these filters were highly underutilized. The PLC that controls these devices was unable to provide analytics to understand why and where the issues were that were hampering production. Within a few months of installing Roxia Malibu digital service monitoring the reasons for the lack of production were analyzed and provided to management.
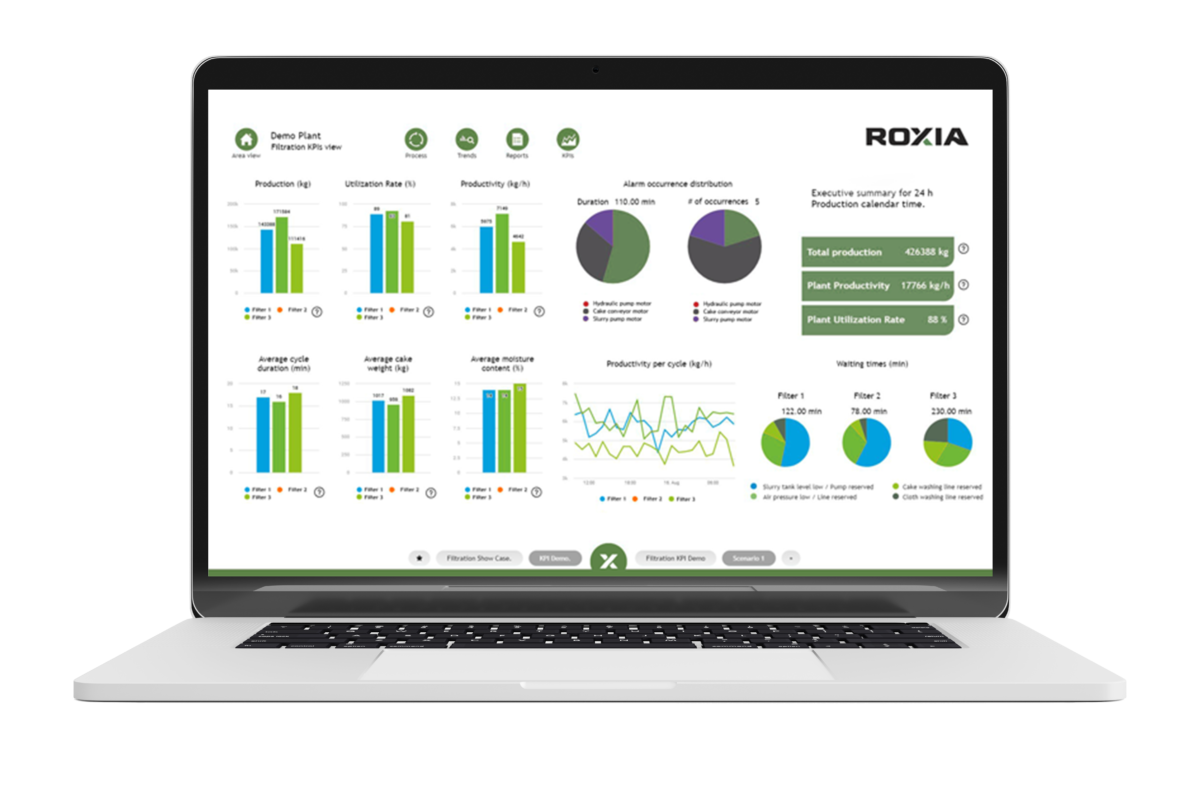
The above KPI page was produced in conjunction with the owner of the three filters. It became an effective tool to understand that filter 2 was consistently producing more production than filters 1 and 3. Filter 2 was also providing drier cake and higher tonnage with shorter cycle times. Digitalization detected that machines 1 and 3 were waiting up to 4 hours daily for pressing water, compressed air and the slurry tank to refill. If the customer can fix those issues, then they can increase production by approximately 26M more kilograms per annum. Other issues such as high-pressure spikes in the compressed air system and pressing water system also helped inform the owners that these issues may be causing damages to membranes and seals.
Conclusions
Regarding the pumps at the beginning of this article, this user has roughly 250 of these pumps installed in their facility. With the savings in increased pump lifetime, lower maintenance costs, optimized energy consumption and greater uptime, this pump user may save tens of millions of dollars per year by utilizing this type of pump monitoring.
In the above digitalized filtration, the consumer had the ability to increase production by 26M more kilograms per year providing they can fix the problems that are hampering the filtration process. This amount of production increase could result in as much as $18M more in saleable zinc annually.
SCADA or DCS systems are effective and have been for decades as an effective way to operate a plant. Today some companies are providing tailor made solutions to complete system, asset or safety monitoring. This type of monitoring does not replace the DCS or SCADA system, but rather is an added level of monitoring and performance optimization not available with traditional DCS or SCADA systems. In every facility there are untapped savings and increased performance through digitalization services. Finding the correct partner is vital to your ability to effectively utilize this information. A partner that works in a consultative manner and develops KPIs that suite your needs may be your best partner.